A data scientist on a growth team needed churn training data and could not use the real customer table. So she generated a synthetic one, and because it was easy, she generated it balanced: half retained, half churned. The model trained fine and then, in production, predicted churn for nearly everyone. It had learned that leaving is a coin flip, because in its training data it was. The fix is not exotic. It is to state the prevalence you actually face and let the generator hold it, instead of balancing and downsampling by hand.
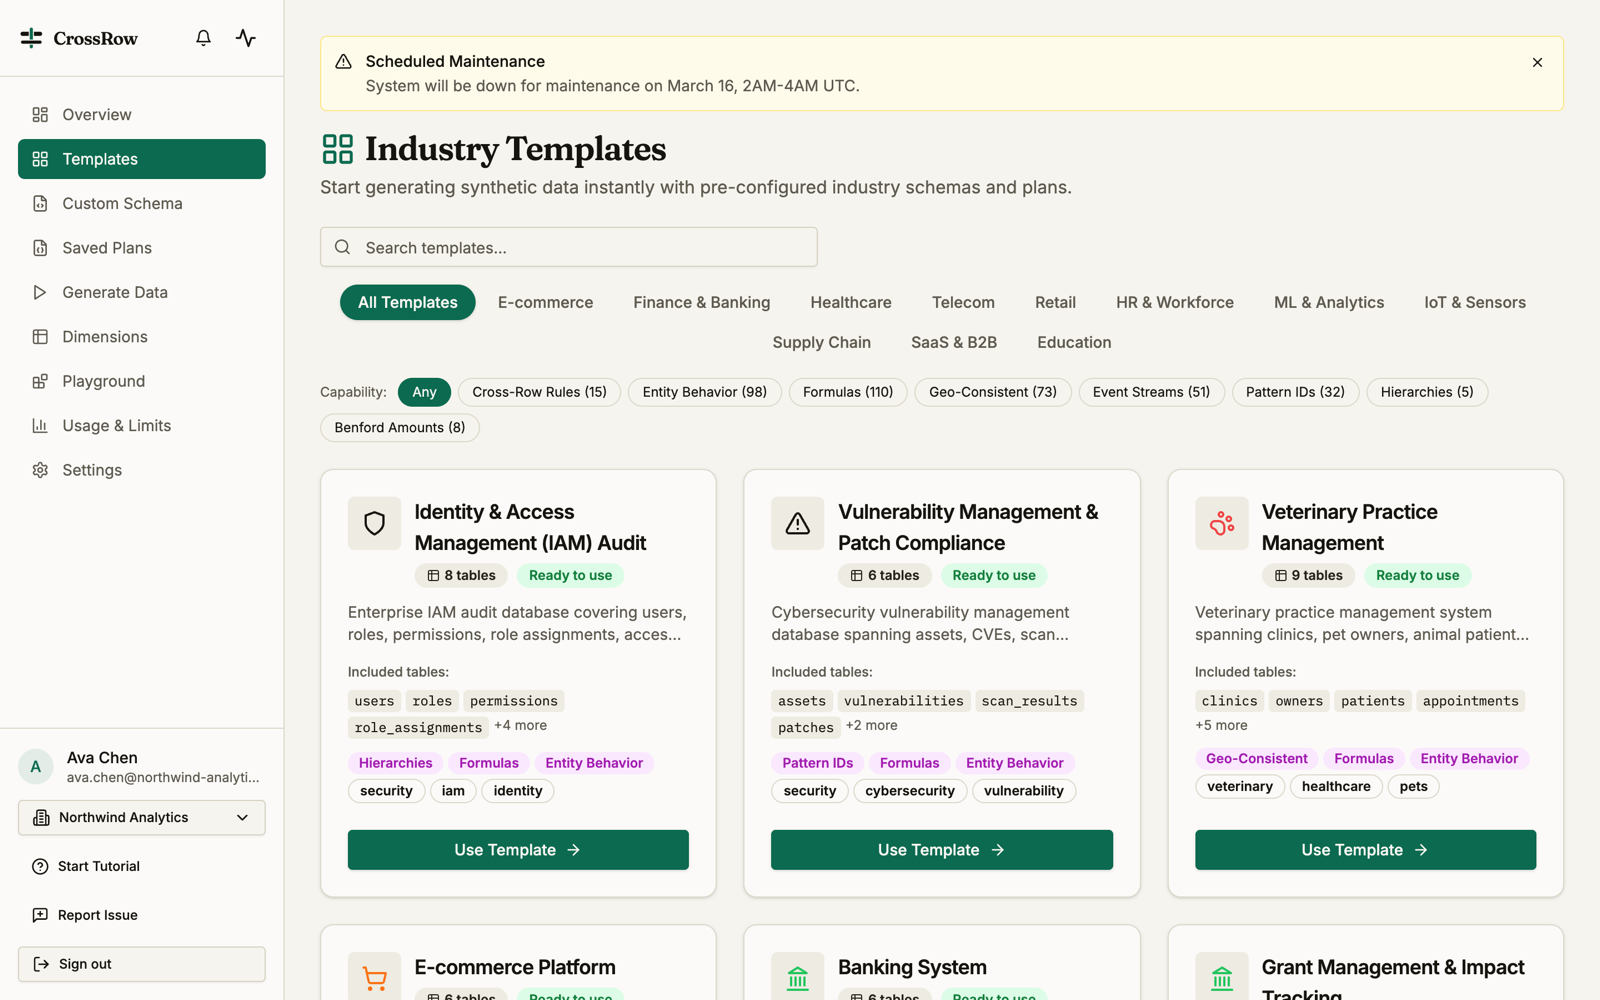
Step 1 · Start from a schema
A table with a label
Any schema with a categorical or boolean outcome works. The fraud, payments, and CRM templates already carry a labeled target, or you can describe your own table and name the column. Open one from Templates as your starting plan.
Step 2 · Set the real rate
State the balance, do not fake it
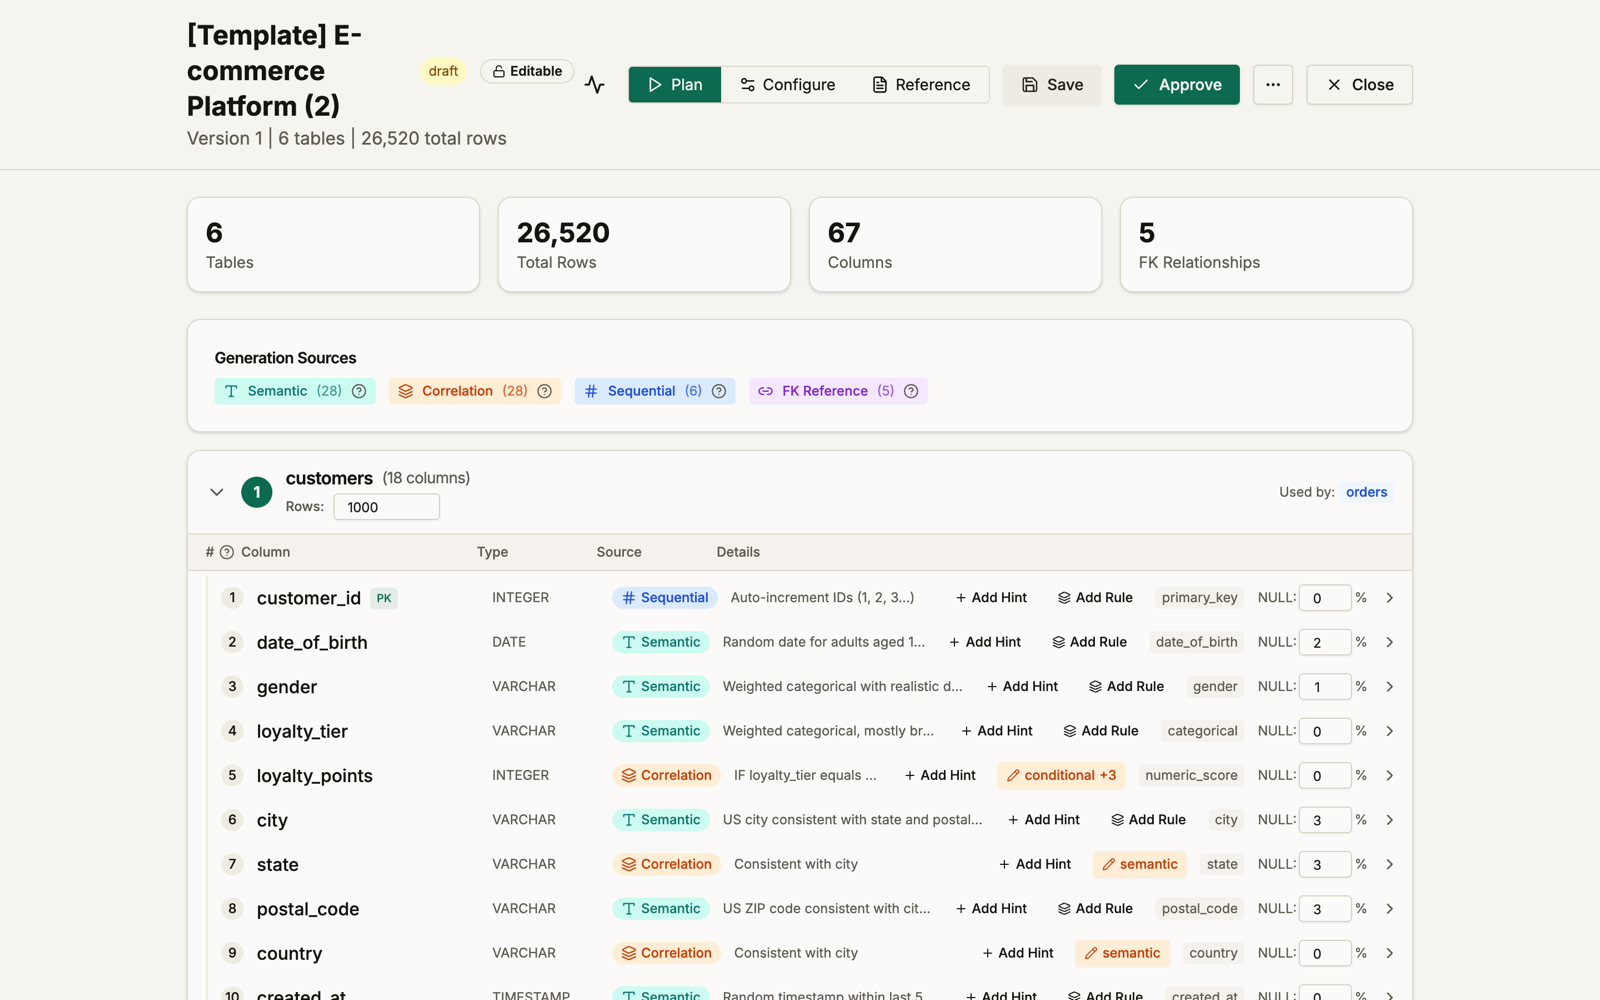
In the plan, the label column is where balance lives. Two controls cover almost everything:
- Boolean true-rate. For a yes/no target like
churnedoris_fraud, set the probability of true directly. Set it to 0.06 and you get roughly six churners per hundred, which is a believable rate for a healthy subscription business. - Weighted categories. For a multi-class target, give each class its real weight. Support-ticket priority might be 70% low, 25% medium, 5% urgent.
You add these as hints on the column, the same place any other rule goes.
Make the rare class distinctive
Getting the rate right is half the job. If your churners are statistically identical to everyone else, the model has nothing to learn and a low base rate just makes it harder. This is where the rest of CrossRow matters: correlations tie the label to the behaviors that should predict it, numeric features keep their real distributions, and if the positives are fraud-like you can concentrate them in a minority of entities. The rare class ends up both rare and recognizable.
Step 3 · Confirm before you train
Read the counts back
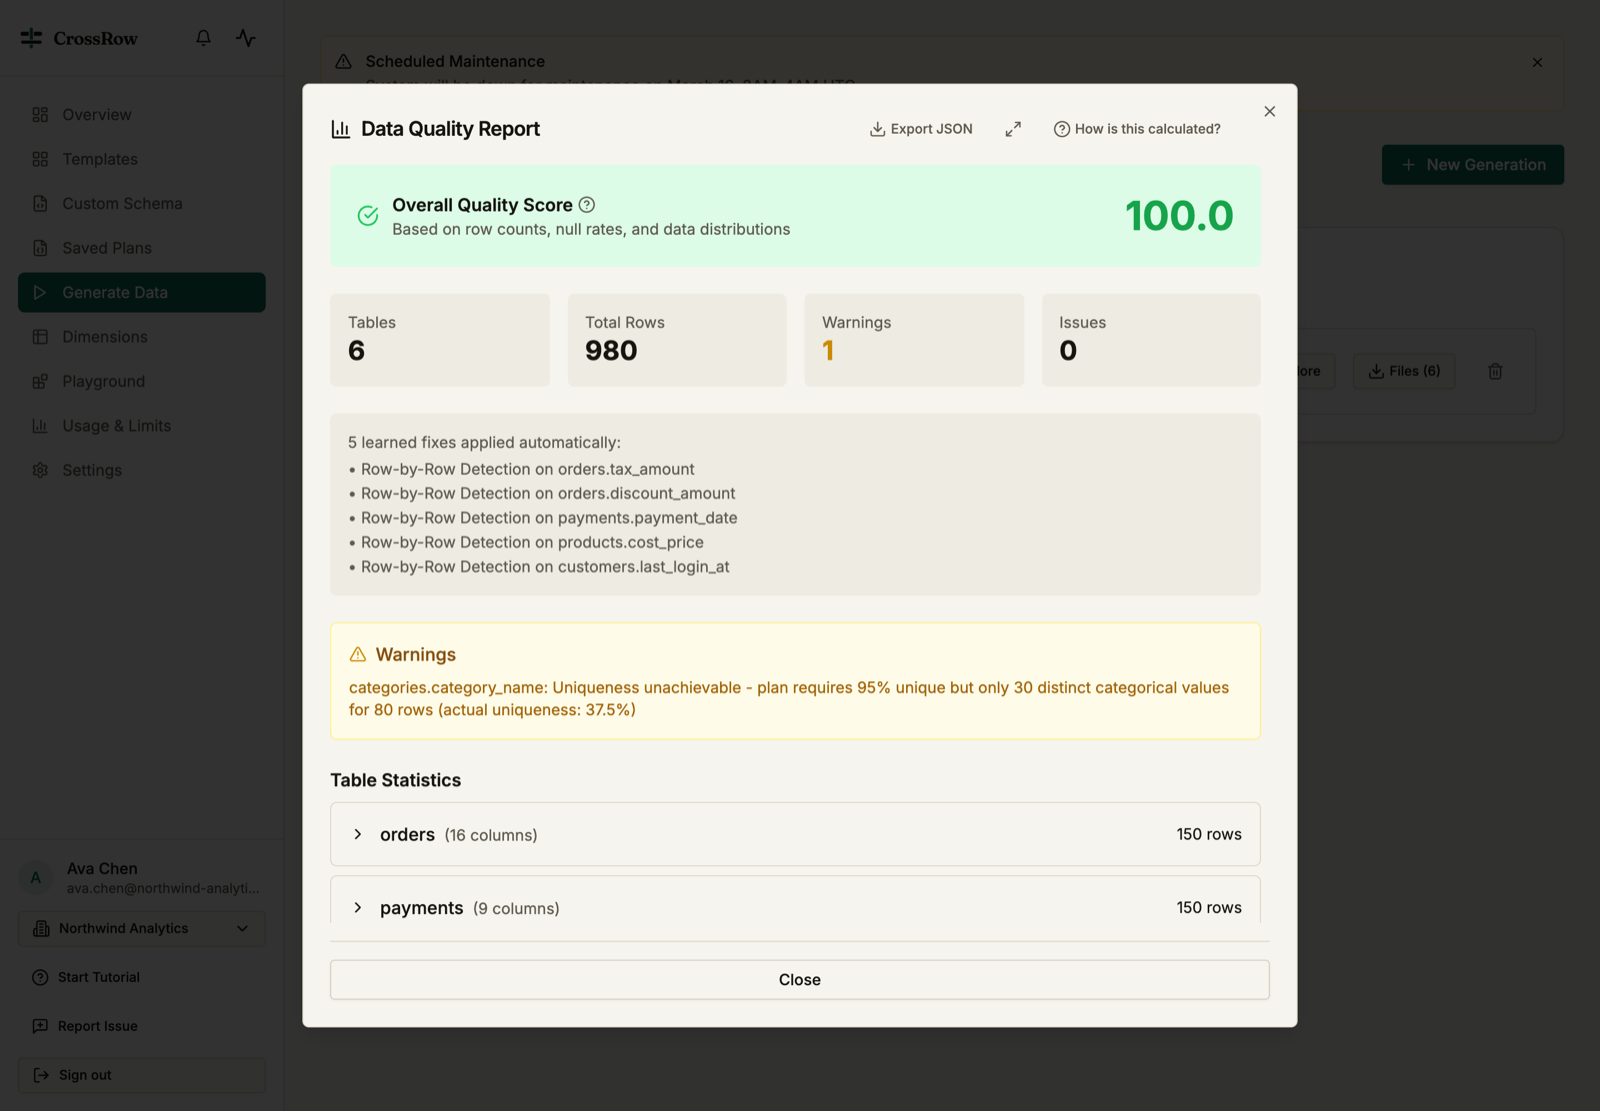
Generate, then open the quality report. It shows the actual distribution of every column, including your label, so you can confirm the prevalence matches what you asked for. And if you asked for something impossible, like more distinct values than the data can supply, the report says so plainly instead of missing the target in silence.
Generating imbalance on purpose is one of the clearest wins for synthetic over real data. You get the exact prevalence you name, exact labels, distinctive positives, and no production records in your pipeline. Balancing a real dump and downsampling gives you none of those. The growth team reset the rate to 6%, retrained, and the model went back to pointing at the customers who were actually about to leave.