CrossRow ships with 125 industry templates: banking, healthcare, e-commerce, telecom, and more. Each one is a complete, prebuilt generation plan you can run as-is or adapt. This walkthrough uses the E-commerce Platform template, but every template follows the same four steps.
Step 1 · Browse templates
Pick a starting point
From the sidebar, open Templates. Each card shows the tables it includes and the capabilities it exercises (geo-consistency, formulas, event streams, and so on). Filter by industry across the top, or by capability just below, to find one close to what you need.
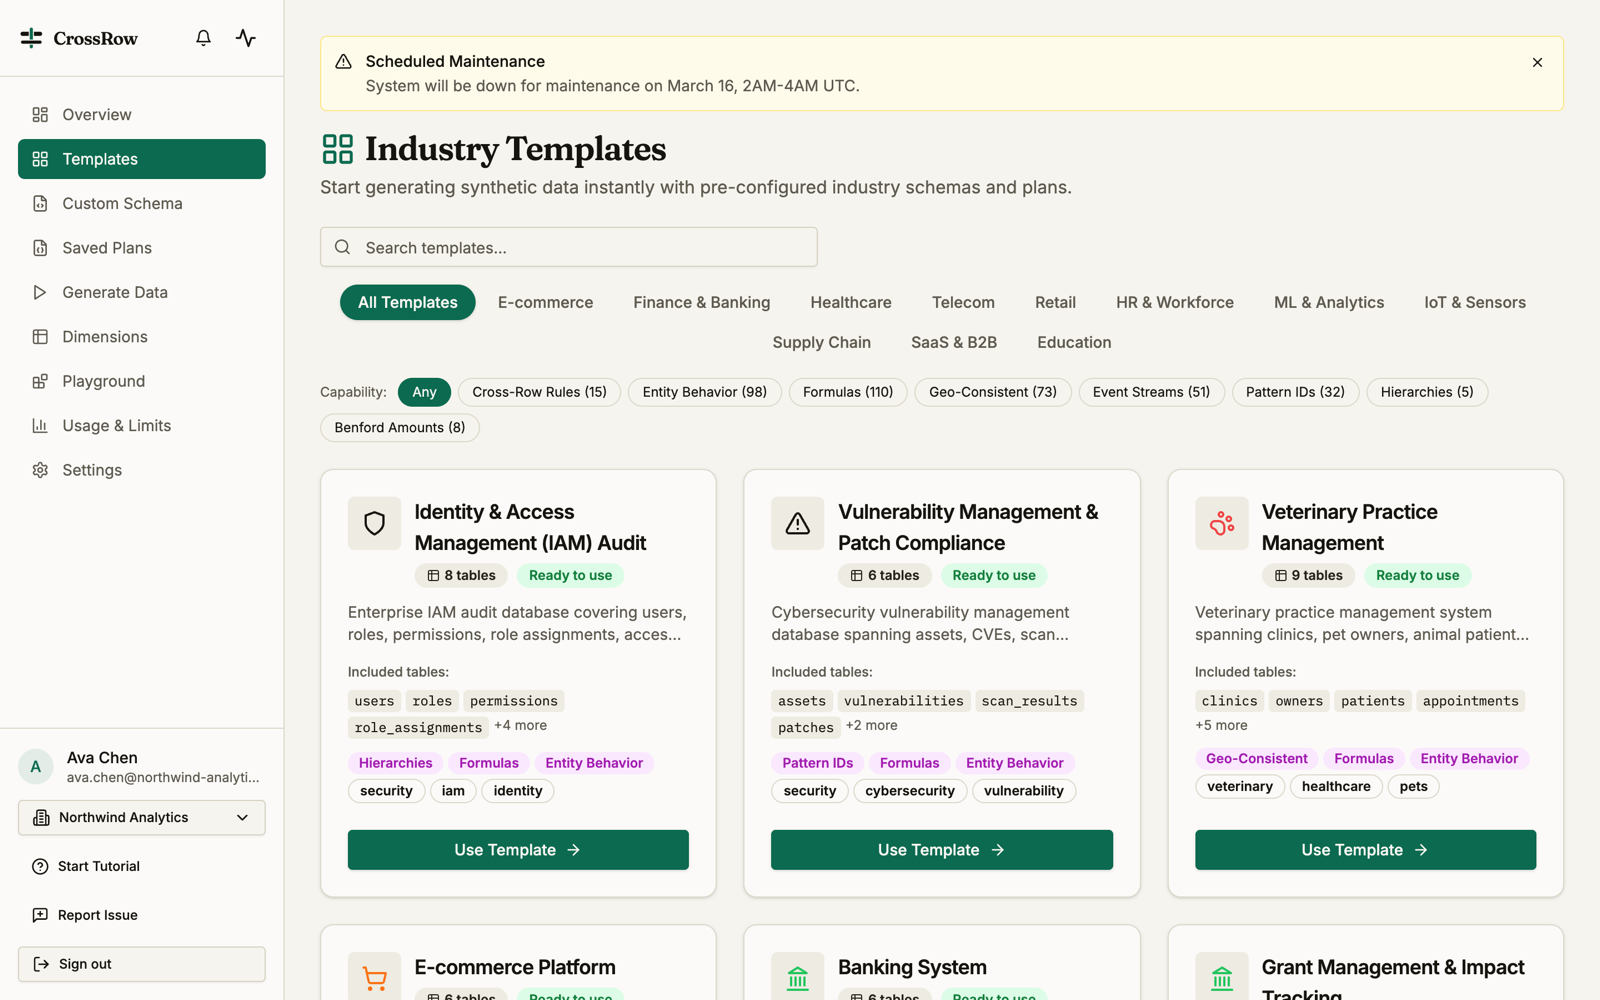
Click Use Template on the one you want. CrossRow copies it into your Saved Plans as an editable plan and opens it for review.
Step 2 · Review the plan
See exactly what will be generated
The plan is where CrossRow shows its work before generating a single row. At a glance you get the table count, total rows, column count, and foreign-key relationships. The Generation Sources strip breaks down how each column is produced: semantic values, correlations, sequential keys, and FK references.
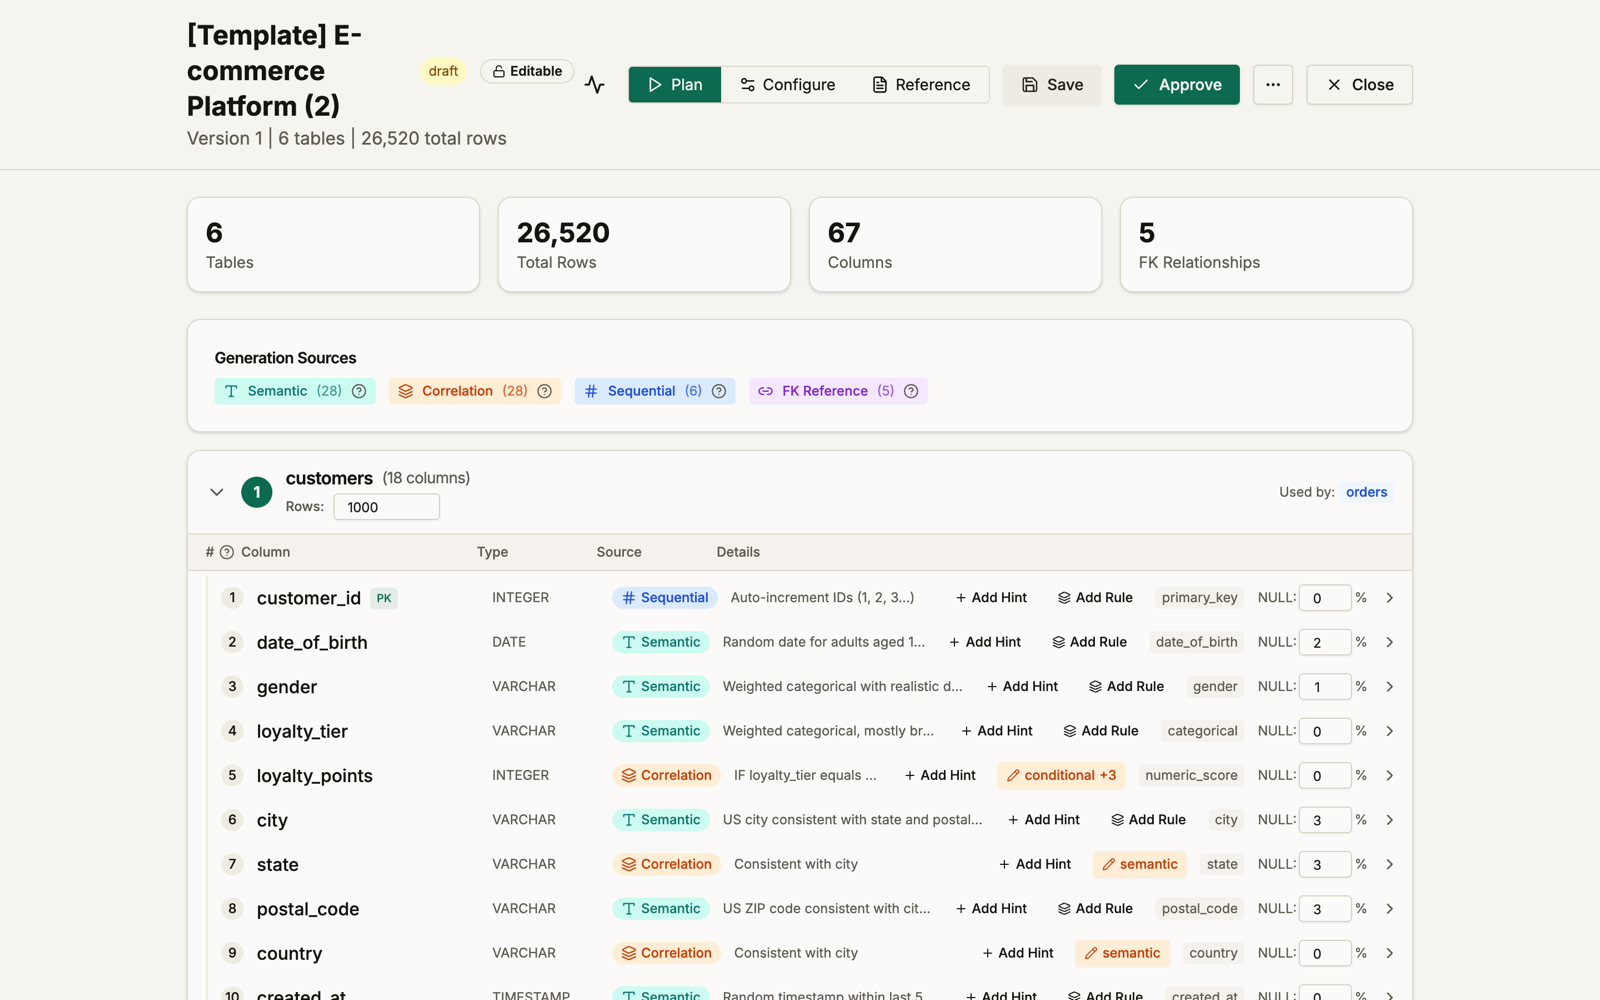
Read down the column list and you can see the relationships the template already knows about. customer_id is a sequential key. gender and loyalty_tier are weighted categoricals. And the address columns are correlated: state and country are both marked consistent with city, so a customer in a given city gets the right state, postal code, and country rather than three independently random values. Add a hint or a rule to any column here, or just accept the template’s defaults. CrossRow also validates the plan at this stage and flags issues like type mismatches before anything runs, so you approve a plan you actually understand.
Step 3 · Generate
Run it, straight to S3
Open Generate Data, choose your row counts and output, and start the run. Generation streams with live progress, so large datasets report as they go. When it finishes, the run appears in your history with its row count, elapsed time, and the part that matters: a quality score.
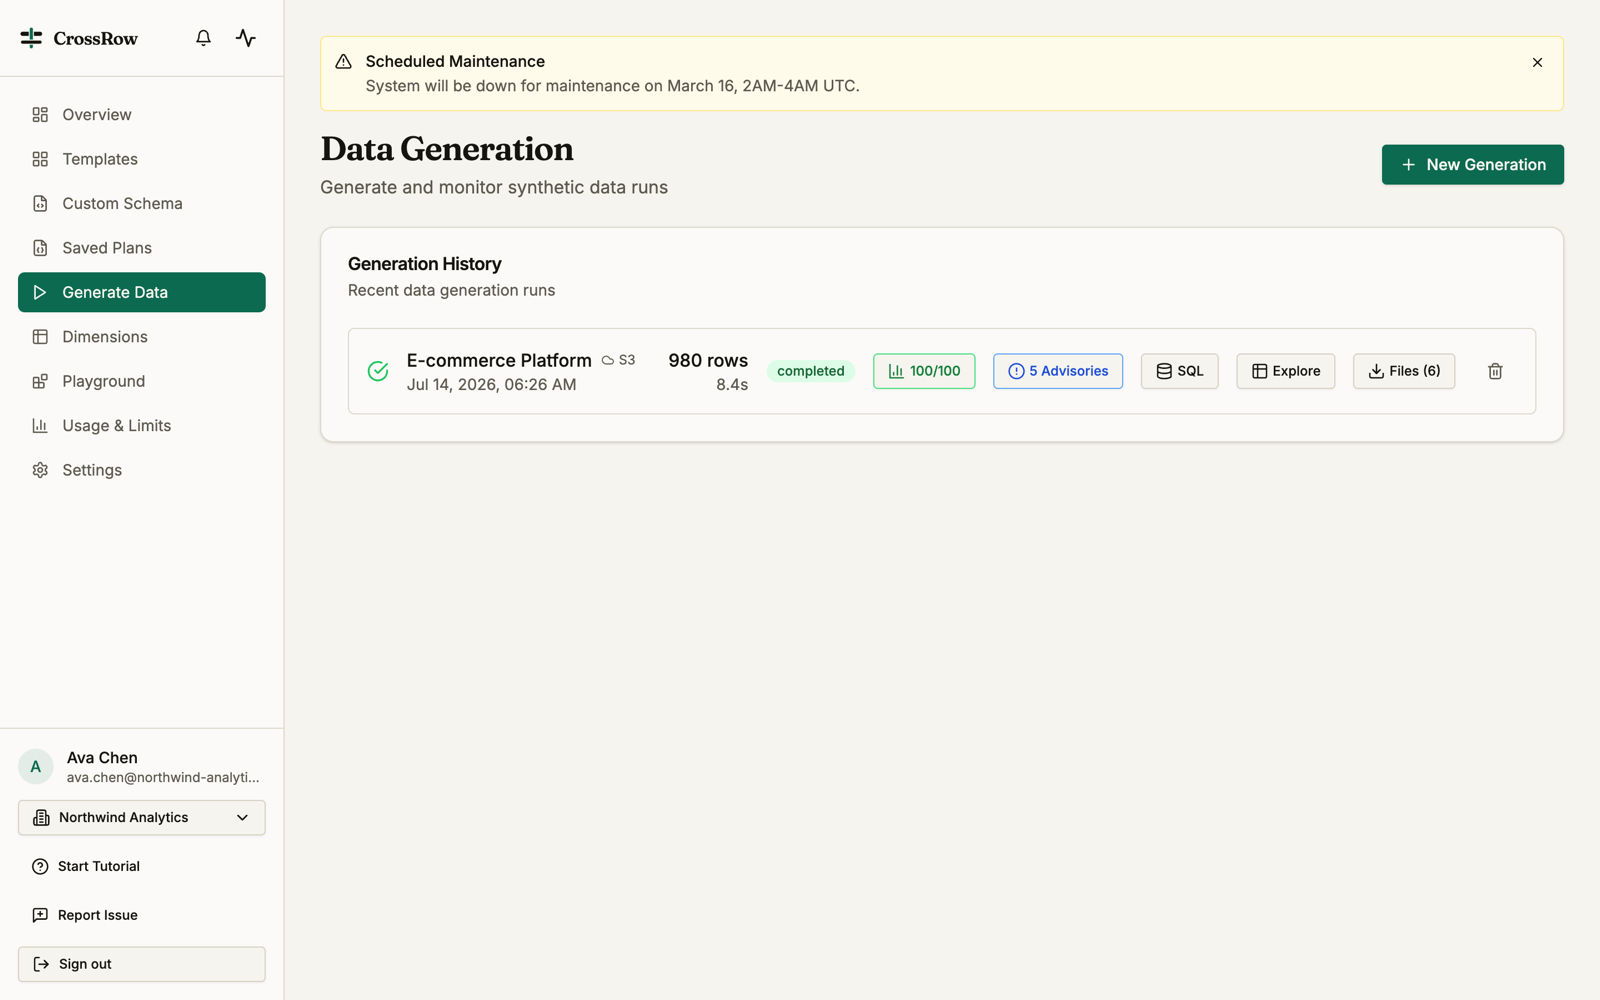
From here you can open the data in SQL, Explore it in the browser, or download the Files. But first, open the score.
Step 4 · Read the quality report
Confirm it before you ship it
Click the score button to open the Data Quality Report. It is computed from the rows that were actually generated, not the plan that was supposed to produce them. The headline is the overall score; below it, the report attributes everything to specific tables and columns.
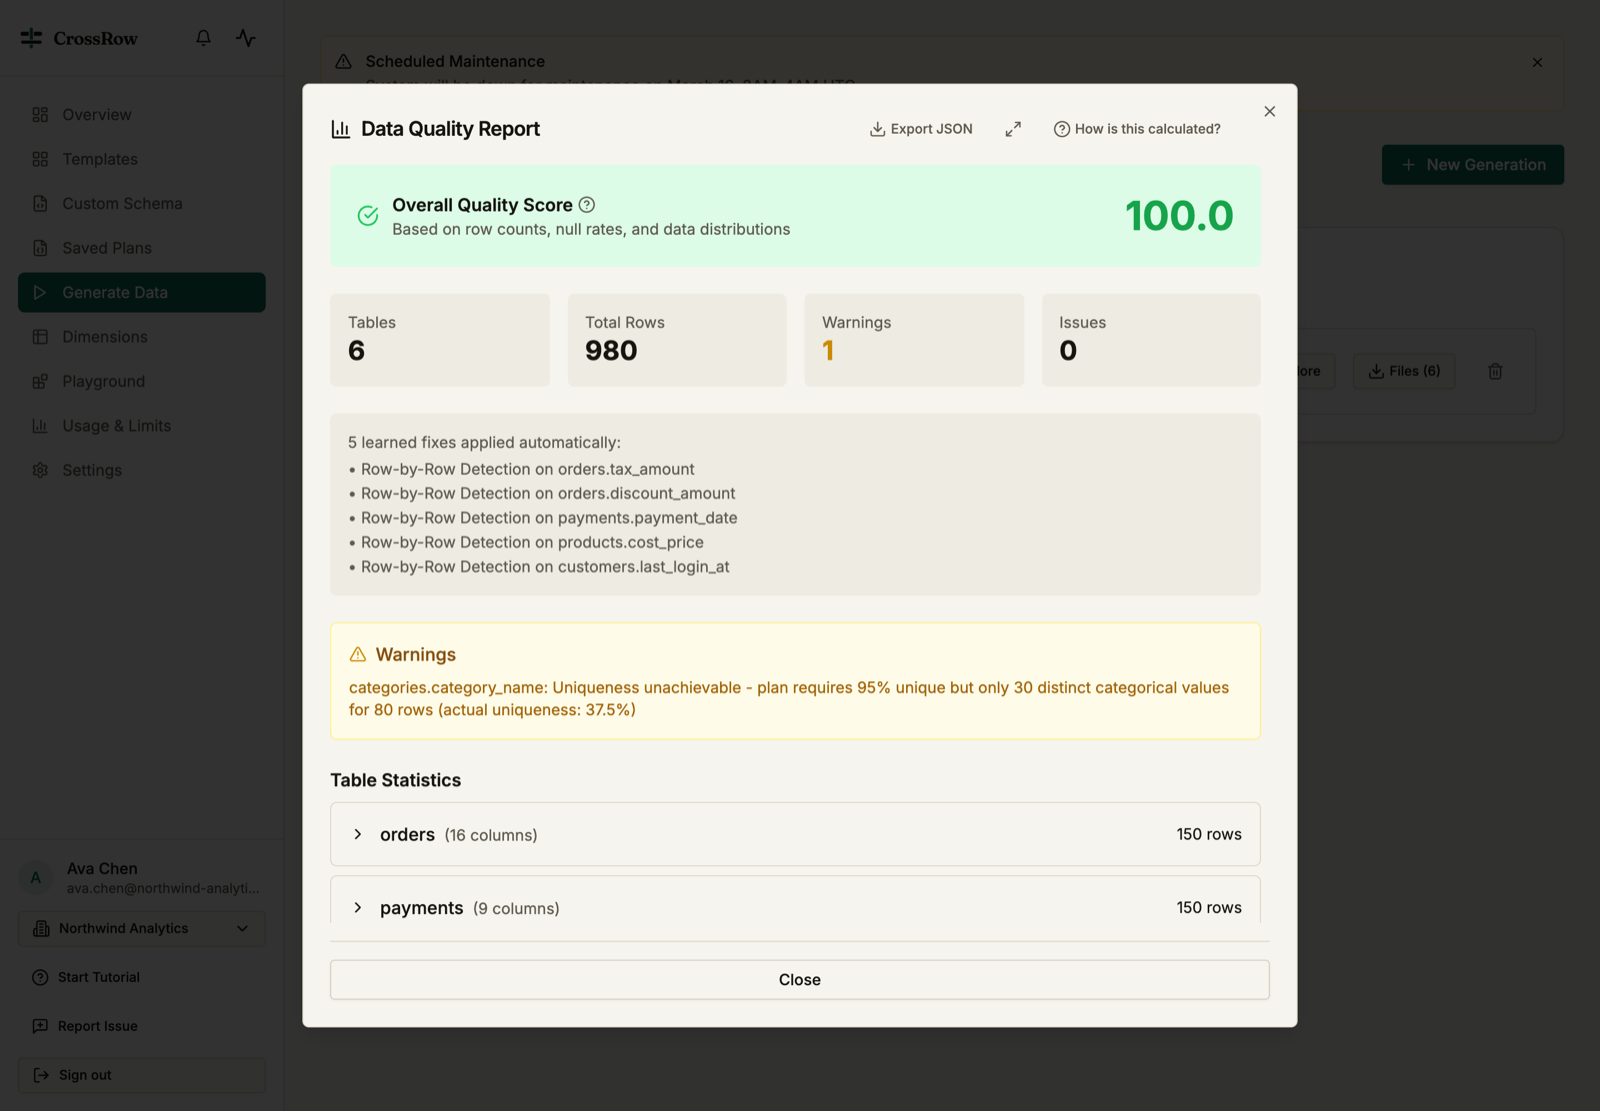
Two things worth reading every time. First, the learned fixes applied automatically: here, row-by-row detection was switched on for several derived columns so their formulas compute correctly. Second, the warnings: this run flags that categories.category_name could not hit 95% uniqueness because the plan only defines 30 distinct values for 80 rows. That is exactly the kind of honest, specific signal you want. Nothing is hidden behind a green checkmark; the report tells you what held and what did not, so you can tighten the plan and regenerate if it matters.
That is the whole loop. Template → plan you can read → generation → a scored report attributed to specific columns. From here, download the files for a test fixture, wire the S3 output into a pipeline, or open Explore to inspect the data directly. Want to understand what the score actually measures? See how CrossRow scores its own output.